Real-world Applications of Visualization in Situational Awareness II
Author: TUBS 
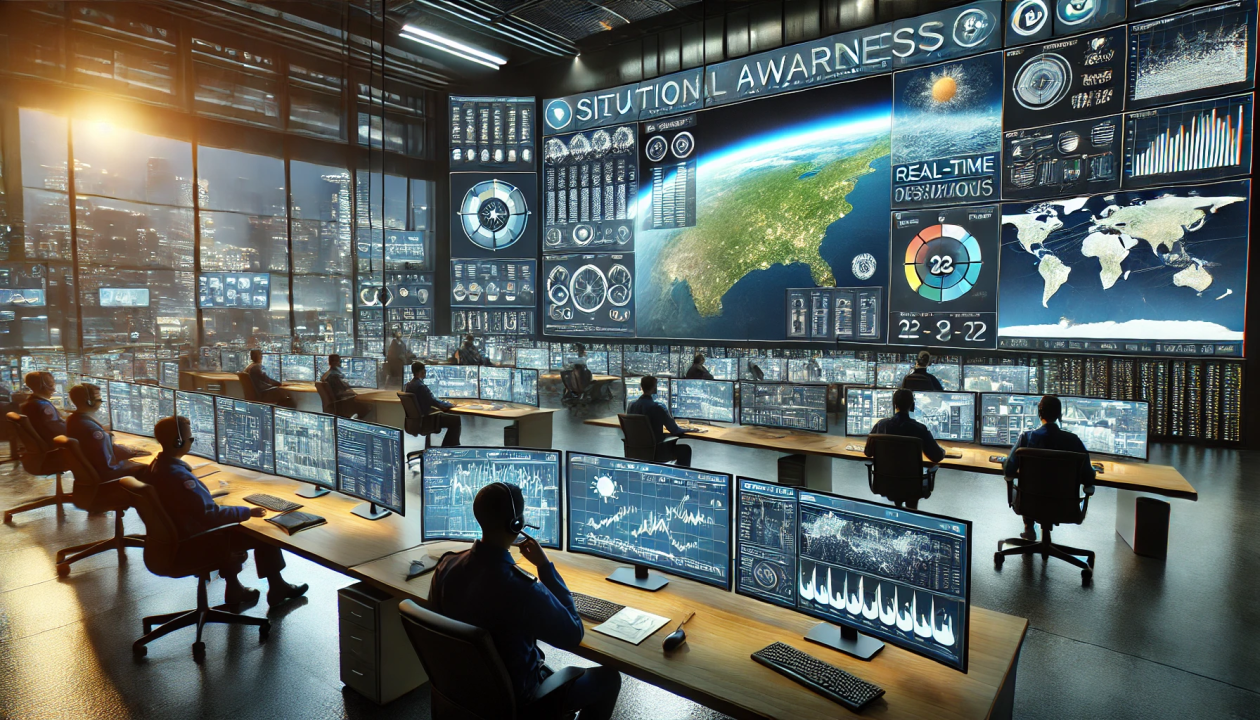
Part 2 transitions from theoretical visualization techniques to practical applications, taking us through real-world scenarios where visualization becomes pivotal in enhancing situational awareness. From crisis management to business intelligence, we unravel how visualizations empower individuals and organizations to navigate and make informed decisions in dynamic environments.
Business Intelligence and Operations
In the business realm, situational awareness is vital for making strategic decisions and optimizing operations. Visualizations enable business leaders to monitor key performance indicators (KPIs), track market trends, and gain insights into the competitive landscape.
Interactive dashboards offer a real-time overview of business operations, allowing executives to monitor sales figures, track inventory levels, and assess customer satisfaction. Geospatial mapping can be employed in logistics to visualize supply chain operations, monitor the movement of goods, and identify potential bottlenecks. Network visualization aids in understanding the relationships between different business units and stakeholders.
Crisis Management and Emergency Response
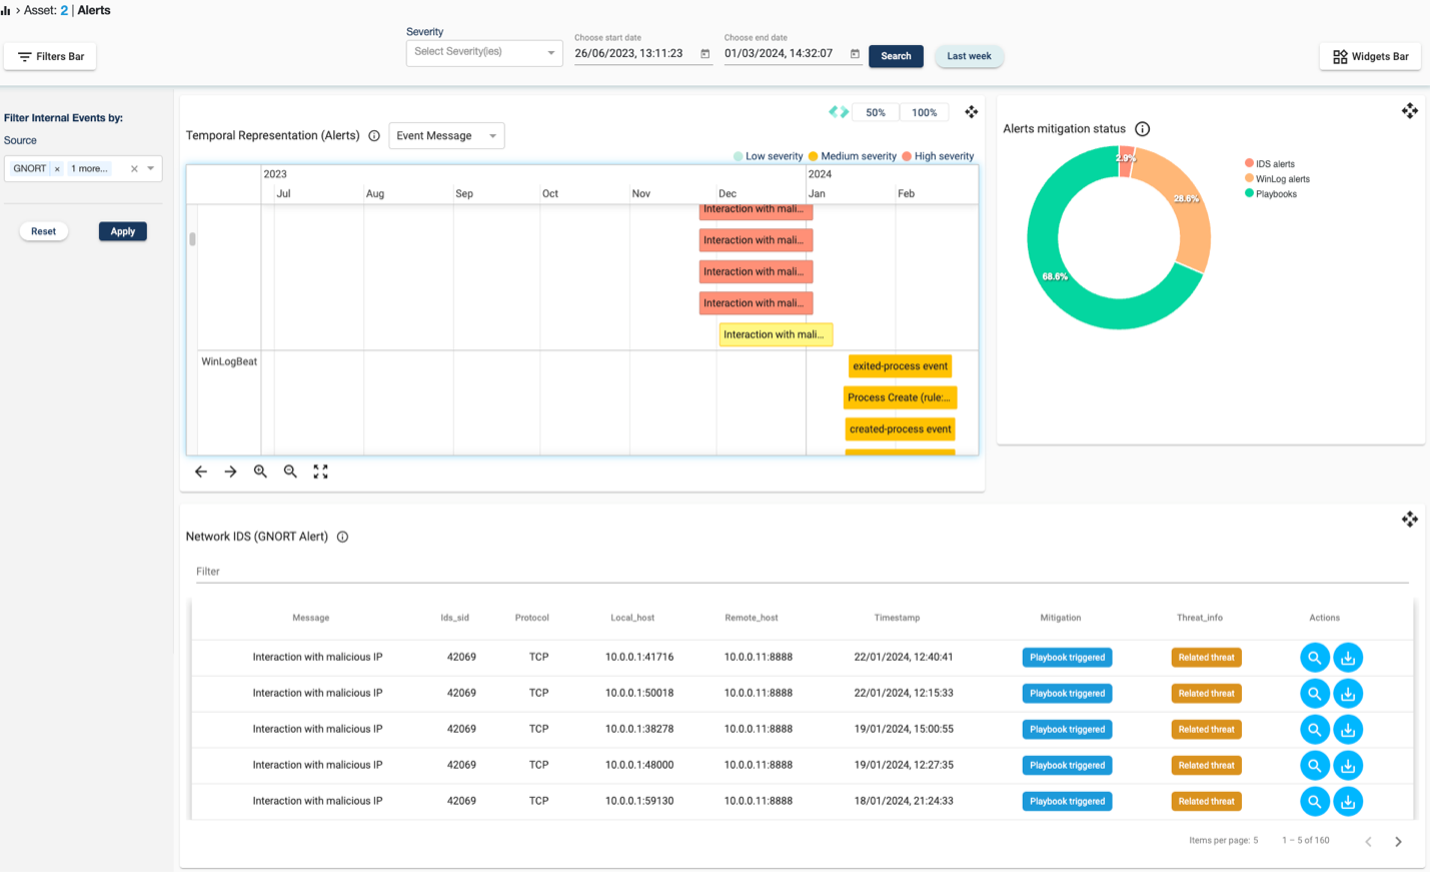
In crisis situations, effective decision-making hinges on timely and accurate information. Visualizations play a crucial role in crisis management and emergency response by providing decision-makers with a real-time and comprehensive understanding of the evolving situation. Even in highly automated environments, a set of carefully selected real-time indicators and visual representations of core or sensitive sources can be of high value to an analyst or operator, whose knowledge combined with clear situational awareness may sometimes lead to different conclusions. When the timely identification of an event is accompanied by the ability of an end-user to instantly perform a quick visual inspection and investigation, decision-making is enhanced.
Interactive dashboards can aggregate information from various sources, such as weather data, social media feeds, and sensor networks, along with any kind of Intrusion Detection System, to provide a unified view of the crisis. Geospatial mapping allows responders to visualize the geographic spread of the crisis and allocate resources strategically. Network visualization aids in understanding the interconnectedness of different elements, facilitating a more coordinated and targeted response.

Figure 1:Dashboard with data visualizations.
Defense and Military Operations
In defense and military operations, situational awareness is a critical factor in strategic decision-making. Visualizations empower military leaders to understand the battlefield, track troop movements, and analyze the geopolitical landscape. This is crucial in the modern battlefield where decision-making takes place in command centers.
Interactive dashboards in military command centers provide a consolidated view of real-time intelligence, allowing commanders to make informed decisions quickly. Geospatial mapping assists in visualizing the terrain, identifying potential threats, and planning strategic movements. Network visualization is employed to understand the relationships between different actors in a conflict, from allied forces to potential adversaries.
Healthcare and Epidemic Response
The healthcare sector relies on situational awareness for epidemic response, resource allocation, and patient care. Visualizations play a crucial role in understanding the spread of diseases, monitoring healthcare resources, and coordinating responses during health crises.
Geospatial mapping is employed to track the geographic spread of epidemics, identify areas with high infection rates, and plan the distribution of medical resources. Interactive dashboards in healthcare settings provide real-time information on patient admissions, bed occupancy, and the availability of medical supplies. Temporal analysis visualizations assist in tracking the progression of diseases over time and predicting future trends.
Conclusion
Part 3 will peer into the future, exploring emerging trends in visualization for situational awareness and their potential impact on dynamic environments.
